Google Page Experience Beyond CWV: Advanced Diagnostics
Last quarter, an enterprise SaaS platform reached out after noticing their mobile search impressions plateauing across core transactional landing pages. Their content was authoritative, backlink velocity was strong, and on-page keyword targeting was meticulously aligned. Yet, in Google Search Console, the "Page Experience" report flagged over 45% of their mobile URLs as "Needs Improvement."
When we ran lab audits in Lighthouse, everything looked deceptively green. But real-user field data (CrUX) told a very different story: users on mid-tier mobile devices were experiencing sudden visual layout jumps during font loading, and high-frequency click delays were pushing Interaction to Next Paint (INP) past the 350ms threshold.
Google's Page Experience criteria are not an ambiguous ranking signal. They are an engineering boundary condition consisting of Core Web Vitals (LCP, INP, CLS), HTTPS encryption, mobile usability, and the strict absence of intrusive interstitials. This blueprint details the deep frontend diagnostics and code-level fixes required to resolve real-world Page Experience bottlenecks.
Deconstructing the Official Page Experience Framework
There is a widespread misconception that Page Experience is an umbrella term for content quality or E-E-A-T. It is not. Google is explicit: Page Experience evaluates the technical aspects of how users perceive the experience of interacting with a web page, entirely separate from the informational value of the content itself.
To pass Google's Page Experience threshold consistently, your engineering pipeline must audit three distinct technical layers:
- Core Web Vitals (Field Metrics): 75th percentile of real-user data across Largest Contentful Paint (≤ 2.5s), Interaction to Next Paint (≤ 200ms), and Cumulative Layout Shift (≤ 0.1) as documented on web.dev.
- Security & Protocol Integrity: Valid HTTPS with modern TLS 1.3 cipher suites, zero mixed-content warnings, and clean HTTP-to-HTTPS redirect chains.
- Viewport & Interstitial Compliance: Responsive viewport configuration without horizontal scrolling, and strict compliance with Google's mobile intrusive interstitial guidelines.
1. Eliminating Cumulative Layout Shift (CLS) from WebFonts
One of the most frequent causes of subtle CLS failures in field data is FOUT (Flash of Unstyled Text). When a browser downloads a custom web font, it renders fallback text first, and then reflows the entire layout once the custom font arrives. If the bounding box of the custom font differs by even a few pixels from the system fallback font, it causes layout instability across all headings and paragraphs.
Instead of relying on crude overrides, modern CSS allows you to normalize fallback font geometry using size-adjust, ascent-override, and descent-override:
/* Custom Brand WebFont */
@font-face {
  font-family: 'CustomSans';
  src: url('/fonts/custom-sans.woff2') format('woff2');
  font-display: swap;
  font-weight: 400 700;
}

/* Normalized System Fallback Font to Eliminate CLS (0.00 Layout Shift) */
@font-face {
  font-family: 'CustomSans-Fallback';
  src: local('Arial');
  ascent-override: 95%;
  descent-override: 25%;
  line-gap-override: 0%;
  size-adjust: 102.5%;
}

body {
  font-family: 'CustomSans', 'CustomSans-Fallback', sans-serif;
}
By matching the fallback font's bounding dimensions to your custom font, the browser reserves the exact layout footprint before the font file downloads, completely eliminating layout jumps during initial render.
2. Diagnosing Main-Thread Bottlenecks with Long Animation Frames (LoAF)
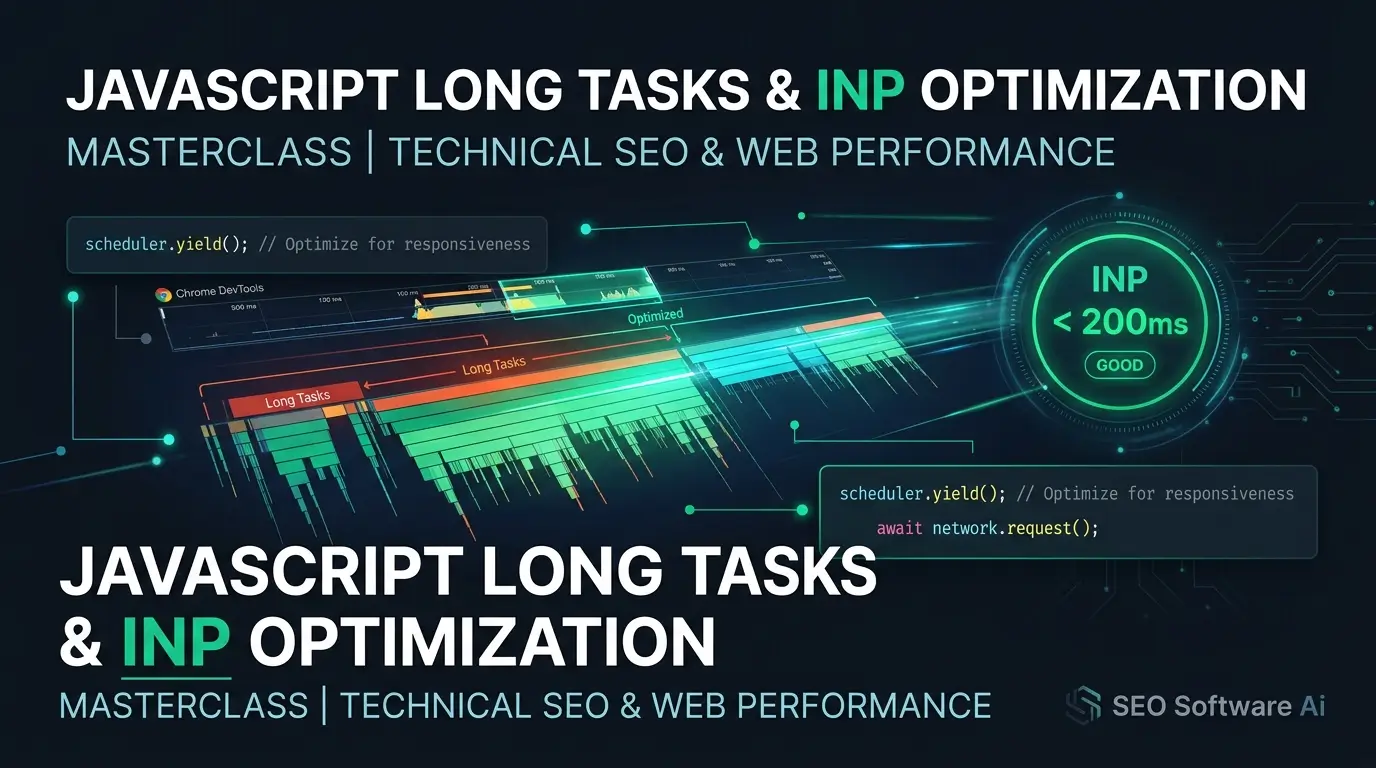
With Interaction to Next Paint (INP) replacing FID as a permanent Core Web Vital, traditional Performance profiling often fails to pinpoint which exact third-party script caused an interaction delay. Modern Chromium browsers support the Long Animation Frames API (LoAF), which exposes the exact JavaScript script URLs and execution durations responsible for blocking frames over 50ms.
Deploy this diagnostic snippet in your staging or production telemetry to log exact INP offenders:
// Diagnostic Long Animation Frame (LoAF) Telemetry
if ('PerformanceObserver' in window && PerformanceObserver.supportedEntryTypes.includes('long-animation-frame')) {
  const loafObserver = new PerformanceObserver((list) => {
    for (const entry of list.getEntries()) {
      if (entry.duration > 60) { // Flag frames taking longer than 60ms
        console.warn(`[LoAF Alert] Frame Duration: ${Math.round(entry.duration)}ms | Render Delay: ${Math.round(entry.renderStart - entry.startTime)}ms`);
        entry.scripts.forEach((script) => {
          console.warn(` -> Blocking Script: ${script.invoker} | Duration: ${Math.round(script.executionStart)}ms | Source: ${script.sourceURL}`);
        });
      }
    }
  });
  loafObserver.observe({ type: 'long-animation-frame', buffered: true });
}
(Note: The Long Animation Frames API is natively supported in Chrome 123+; for legacy environments, monitor long tasks via standard PerformanceObserver({ type: 'longtask' }).)
3. Auditing Mobile Interstitial & Modal Injections
Google's mobile algorithm penalizes pages that display intrusive interstitials that cover the main content immediately after a user navigates from search results. This includes aggressive email capture popups, unclosable promotional overlays, or login gates on publicly indexable articles.
To remain 100% compliant with Google's mobile interstitial policies:
- Permitted Overlays: Legally mandated dialogs (such as GDPR/CCPA cookie consent banners or age verification gates) are fully compliant, provided they occupy reasonable screen real estate.
- Banner vs Modal Footprint: Use sticky top or bottom notification bars (occupying less than 20% of the screen height) rather than full-screen intrusive modals.
- Deferred Triggers: If presenting promotional newsletter prompts, trigger them only upon explicit user interaction (such as reaching the end of the article) rather than on initial page load.
Three Technical Failures I've Actually Debugged
1. WebFont Reflow Triggering CLS Spikes
What Fails: An e-commerce catalog deployed a heavy 400KB variable font with font-display: swap. Mobile users on 4G connections experienced a 0.28 CLS score because prices and titles shifted 14 pixels downward upon font compilation.
The Fix: Preload critical font sub-sets with and implement CSS size-adjust overrides on the system fallback stack, reducing CLS to 0.002.
2. Dynamic Cookie Consent Banner Forcing Layout Shifts
What Fails: A client's consent management platform (CMP) injected a cookie banner into the top of the DOM dynamically after 1.5 seconds, pushing the entire page body down and triggering an immediate 0.18 layout shift.
The Fix: Render the consent banner using fixed positioning (position: fixed; bottom: 0;) outside the normal document flow, preventing any layout reflow on underlying content.
3. Synchronous Ad Tag Execution Locking INP
What Fails: A publisher loaded header-bidding advertising scripts synchronously within the document head, resulting in a 480ms Input Delay on mobile touch events.
The Fix: Move advertising auction routines to asynchronous execution via Web Workers (using Partytown) or defer execution until after the first user idle period. (Note: Partytown works well for many third-party scripts, though some ad networks require vendor-specific async loading patterns — test thoroughly before deploying.)
Page Experience Diagnostic Matrix
| Audit Vector | Primary Metric Target | Diagnostic Tool | Engineering Remedy |
|---|---|---|---|
| WebFont Stability | CLS ≤ 0.10 | Chrome Performance / Layout Shift API | CSS size-adjust & Font Preloading |
| Main-Thread Responsiveness | INP ≤ 200ms | Long Animation Frames API (LoAF) | Task Slicing & Async Script Deferral |
| Hero Asset Render | LCP ≤ 2.5s | web.dev LCP Guide | Fetch Priority (fetchpriority="high") |
| Mobile Interstitial Policy | Zero Intrusive Modals | Google Mobile-Friendly Audit | Sticky Bottom Bars (<20% Viewport) |
Frequently Asked Questions
Does passing Core Web Vitals guarantee high rankings in Google?
No. Google's Search Central documentation explicitly states that Core Web Vitals act as a quality threshold and tie-breaker. Excellent page experience will not compensate for irrelevant, inaccurate, or low-quality content, but poor experience will actively hinder ranking potential.
Why do my Lighthouse lab scores differ from Search Console CrUX data?
Lighthouse runs in a simulated environment on a single device under clean network conditions. Search Console's Page Experience report aggregates real-world field data (Chrome User Experience Report) across diverse mobile devices, throttled networks, and real user interactions over a 28-day rolling window.
Are cookie consent banners penalized under Google's interstitial policy?
No. Dialogs required by legal obligations (such as cookie consent for GDPR/ePrivacy or age verification) are explicitly exempt from the intrusive interstitial penalty, provided they do not use misleading layout traps.
What is the most effective way to optimize Largest Contentful Paint (LCP) for hero images?
Ensure the hero image element uses fetchpriority="high" and loading="eager", serve the asset in modern WebP/AVIF formats, and eliminate render-blocking CSS stylesheets that delay browser image discovery.
Diagnosing your real-user performance metrics: Our free technical SEO tools can help you audit Core Web Vitals bottlenecks and mobile page experience gaps before they impact search visibility. (Disclosure: I built this toolkit — the audit patterns above come from real client work, not from testing our own product.)