YouTube Thumbnail A/B Test: CTR vs. Watch Time Trade-offs
Key Diagnostic Takeaways
- Clicks are hypotheses, not endorsements: YouTube’s recommendation system treats an initial click as an invitation to measure viewer satisfaction, not proof of quality.
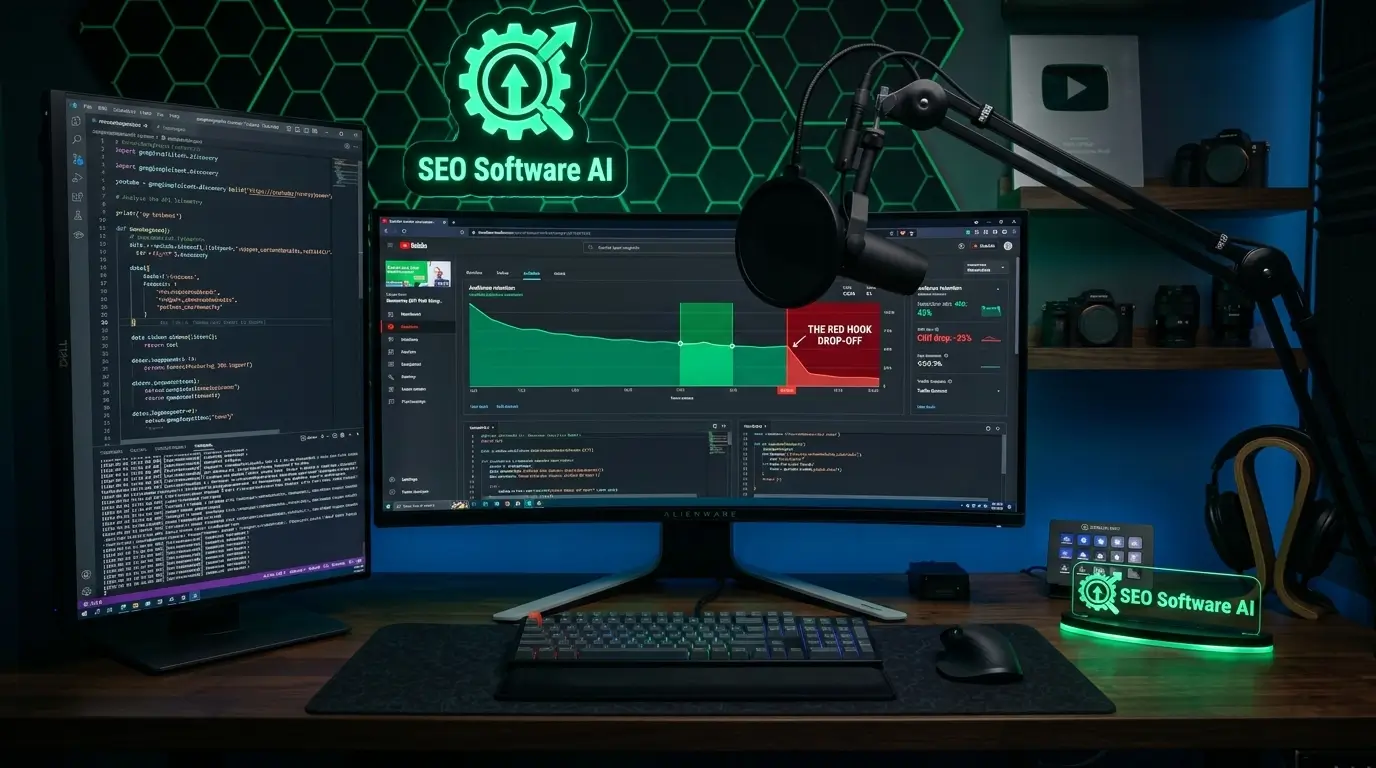
- The retention cliff: Thumbnails that generate high click-through rates (CTR) by over-promising cause immediate viewer drop-off, triggering negative recommendation signals.
- Watch Time Share over raw CTR: Modern split-testing must prioritize total watch time generated per impression rather than percentage click volume alone.
- Mobile viewport reality: More than two-thirds of video discovery happens on small mobile feeds where complex thumbnail text renders as unreadable visual clutter.
A YouTube thumbnail that doubles your click-through rate can quietly cut your channel’s total impressions in half. This counterintuitive dynamic catches creators and growth teams off guard when they rely exclusively on third-party A/B testing tools that declare winners based on raw CTR. When a thumbnail variant attracts viewers through curiosity or exaggeration, but the opening thirty seconds of the video fail to deliver on that specific expectation, viewers exit immediately. To YouTube’s recommendation neural networks, this behavioral pattern signals a broken promise. The algorithm responds by dampening broader distribution across Browse and Suggested surfaces.
Optimizing thumbnails effectively requires examining how click velocity interacts with downstream audience retention. Below is an engineering framework for evaluating thumbnail split tests, accounting for platform-level algorithmic trade-offs, and avoiding false positives in performance data.
How YouTube’s Recommendation System Evaluates Click Signals
YouTube’s recommendation architecture relies on a multi-stage machine learning system that balances initial interest against post-click satisfaction. In technical documentation and platform research, this is frequently framed around candidate generation (retrieving potential videos based on history) and candidate ranking (ordering those videos based on predicted watch time and utility).
Because the platform aims to maximize cumulative, satisfied user sessions, the algorithm does not reward clicks in isolation. Instead, it measures several distinct downstream indicators:
- Initial Retention (0:00–0:30): The percentage of viewers who remain engaged past the first half-minute. A steep drop here indicates a mismatched thumbnail premise.
- Average View Duration (AVD): The total time a given audience segment invests in the video.
- Session Impact: Whether the viewer continues watching content across the platform or closes the application in frustration.
Heuristic Framework: Expected Watch Time per Impression (WTI)
WTI (seconds) = CTR (as a decimal) × Average View Duration (in seconds)
Note: This formula is a conceptual diagnostic heuristic proposed for analytical modeling, not an internal proprietary metric published by YouTube. It helps teams quantify the trade-off between click volume and viewer retention.
Consider a hypothetical comparison between two thumbnail designs for an educational tutorial:
- Hypothetical Variant A (Sensational): Achieves an 11% CTR, but viewers realize the content is complex and average only 90 seconds before leaving. WTI = 0.11 × 90 = 9.9 seconds of watch time delivered per impression.
- Hypothetical Variant B (Descriptive): Produces an 8% CTR, but accurately attracts dedicated learners who watch an average of 240 seconds. WTI = 0.08 × 240 = 19.2 seconds delivered per impression.
Despite gathering fewer initial clicks, Variant B delivers almost double the aggregate watch time per impression. YouTube’s distribution engine routinely favors this pattern for sustained recommendations.
Native 'Test & Compare' vs. Third-Party Thumbnail Swapping
Historically, creators relied on external tools that rotated image files on a timer (e.g., swapping thumbnails every 24 hours). This approach introduces confounding variables: weekday traffic behaves differently from weekend traffic, external news cycles distort view volumes, and notification spikes skew early testing windows.
YouTube’s native Test & Compare feature resolves this by serving up to three thumbnail variants concurrently to randomized viewer samples. Crucially, YouTube evaluates native tests using Watch Time Share rather than click counts. When running or interpreting split tests:
- Segment by Traffic Surface: Thumbnails intended for YouTube Search must prioritize clarity and keyword relevance. Thumbnails targeted at Browse or Suggested surfaces need visual contrast and an intriguing conceptual hook.
- Check the 30-Second Baseline: If a thumbnail variant shows an elevated CTR but a significantly steeper cliff in the first 30 seconds of the retention graph, treat that variant as a false positive.
- Allow Sample Maturation: Avoid calling tests prematurely. High initial CTR during the first few hours often reflects subscriber loyalty rather than broad audience appeal.
Measuring Variant Impact with the YouTube Analytics API
While YouTube Studio reports native split-test winners, teams building internal reporting pipelines often extract historical performance data via the Google API Client. The script below demonstrates how to query video-level engagement metrics for a designated evaluation window and compute the Expected Watch Time per Impression heuristic:
from googleapiclient.discovery import build
from google.oauth2.credentials import Credentials

def calculate_variant_wti(channel_id, video_id, observed_ctr_decimal, start_date, end_date, creds_path):
    """
    Queries YouTube Analytics API v2 for engagement data and calculates
    Expected Watch Time per Impression (WTI) using an observed CTR value.
    """
    credentials = Credentials.from_authorized_user_file(creds_path)
    analytics = build('youtubeAnalytics', 'v2', credentials=credentials)

    request = analytics.reports().query(
        ids=f'channel=={channel_id}',
        startDate=start_date,
        endDate=end_date,
        metrics='views,averageViewDuration,estimatedMinutesWatched,averageViewPercentage',
        dimensions='video',
        filters=f'video=={video_id}'
    )
    response = request.execute()

    rows = response.get('rows', [])
    if not rows:
        return {"error": "No performance records found for date range"}

    data = rows[0]
    views = int(data[1])
    avg_duration_sec = float(data[2])
    total_minutes = float(data[3])
    retention_pct = float(data[4])

    # Compute heuristic: Expected Watch Time per Impression
    wti_seconds = round(observed_ctr_decimal * avg_duration_sec, 2)

    return {
        "video_id": video_id,
        "sample_views": views,
        "average_view_duration_seconds": avg_duration_sec,
        "average_view_percentage": retention_pct,
        "total_watch_hours": round(total_minutes / 60.0, 2),
        "expected_watch_time_per_impression_sec": wti_seconds
    }

# Example execution: testing a variant with an observed 8.5% CTR (0.085)
# results = calculate_variant_wti('UCxxxxxx', 'dQw4w9WgXcQ', 0.085, '2026-01-01', '2026-01-14', 'creds.json')
Thumbnail Strategy Matrix: Comparing Algorithmic Trade-offs
Different visual compositions elicit distinct user behaviors. The matrix below outlines how primary design approaches impact downstream metrics:
| Visual Approach | Primary Mechanism | Typical CTR Profile | Downstream Retention Risk | Algorithmic Outcome |
|---|---|---|---|---|
| Hyperbolic / Vague Hook | Shock imagery, exaggerated facial expressions, unanswered prompts | Elevated initial click rate across broad traffic | High Risk: Immediate bounce if content fails to match intensity | Short-term impression spike followed by distribution dampening. |
| Content-Aligned Technical | Accurate interface screenshot, specific data point, precise topic naming | Moderate, qualified click volume | Low Risk: High audience alignment past 30 seconds | Steady long-tail distribution across Search and Suggested video feeds. |
| Consistent Series Branding | Unified typographic hierarchy, recurring badge position, brand color accents | Predictable among returning subscribers | Very Low Risk: Pre-qualified, loyal audience | Supports higher session completion rates and multi-video binge sessions. |
| Minimalist Mobile-First | Maximum 2–3 words, high contrast ratio, large focal object | Strong performance on handheld devices | Moderate: clarity prevents accidental or mistaken clicks | Optimizes for handheld feeds where intricate designs fail. |
Practical Field Scenarios: Analyzing Common Optimization Errors
Scenario A: The B2B SaaS Click Misdirection
Consider an educational channel focused on database architecture. During a split test, Variant 1 used a neon graphic displaying “Speed Up Queries 100x” while Variant 2 displayed an annotated PostgreSQL execution plan diagram with the label “Index Scan Fix.”
Variant 1 gathered a substantially higher click rate, prompting the team to select it. However, the subsequent audience retention curve revealed that viewers left in droves within the first minute once they realized the video was a deep-dive command-line demonstration rather than a quick configuration toggle. Meanwhile, viewers who chose Variant 2 watched nearly the entire lesson.
Scenario B: Viewport Readability and Mobile Disconnect
A common pitfall occurs when designers build and review thumbnails exclusively on large desktop displays. When evaluating thumbnail efficacy across devices, contrast the following two states:
Six words of 24pt text, dual split-screen screenshots, small badge icons. Clear on a 27-inch monitor; illegible gray blur when scaled to 320px in the mobile YouTube application feed.
Two words in bold high-contrast sans-serif, one dominant central object, minimal background distractions. Instantly comprehensible on small smartphone viewports.
Because mobile devices account for the majority of YouTube watch time, designs that fail mobile legibility suppress overall click volume and drag down blended channel performance.
Scenario C: Visual Stagnation on Recurring Annual Topics
Channels producing recurring seasonal or annual guides often recycle previous high-performing graphics, merely modifying a date label (e.g., updating “2025” to “2026” while preserving the identical background and layout).
The Latent Problem: Dedicated subscribers scanning their feeds subconsciously process the familiar graphic as content they have already consumed. When your most loyal viewers scroll past an upload, the initial distribution velocity stalls, causing the platform to curtail wider promotion.
Frequently Asked Questions
Why does YouTube’s native Test & Compare tool declare winners based on watch time share rather than CTR?
YouTube’s business model depends on long-term user satisfaction and session duration. A thumbnail that produces high click rates but prompt abandonment harms user experience. Measuring total watch time share ensures that the winning variant attracts viewers who find genuine value in the video.
How long should a thumbnail split test run before concluding?
Rather than relying on a fixed calendar window, tests should run until each variant accumulates sufficient impression volume across diverse traffic sources. In YouTube’s native tool, tests typically run until the system reaches high statistical confidence, which can take anywhere from a few days to two weeks depending on channel velocity.
Can updating a thumbnail revive distribution for an older video?
Yes. Updating metadata and thumbnail packaging prompts YouTube to test the video with fresh impression samples in Browse and Suggested feeds. If the updated design produces higher engagement and sustained retention compared to the historical baseline, distribution can expand significantly.
Should thumbnail text repeat the video title exactly?
No. Repeating the video title verbatim wastes valuable visual real estate. Effective thumbnails use short, punchy phrases (2–4 words) that complement the title by highlighting a key outcome, posing a challenge, or clarifying the visual subject.
Optimize Your Video SEO & Viewer Retention:
Before testing thumbnails, ensure your opening scripts, video structure, and metadata are engineered for audience satisfaction. Explore our free tool suite: