YouTube Audience Retention: Fix Decay & A/B Test Hooks
Consider a technical channel where search impressions and click-through rates stay healthy, yet organic recommendation volume from YouTube's Home and Suggested feeds quietly declines. The cause is frequently invisible in impressions data and only surfaces in the retention curve itself: when early viewer drop-off flags uploads as low-satisfaction content inside YouTube's recommendation neural networks, distribution across Browse and Suggested surfaces is curtailed automatically. If your retention slope crashes in the opening seconds of playback, optimization efforts focused solely on titles, tags, or external promotional links will struggle to drive sustained recommendation performance. Diagnosing retention decay curves and systematically engineering video hooks is not a stylistic preference — it is an algorithmic necessity for technical creators and digital publishers.
Categorizing Retention Decay Curve Mathematics
To diagnose and remedy audience drop-off, you can treat the YouTube retention graph as a continuous mathematical function rather than a simple visual chart in YouTube Studio. Audience retention R(t) represents the percentage of unique viewers still actively watching at time t relative to total initial play events. The first derivative of this curve, R′(t), reveals the instantaneous rate of audience decay at any given second. When analyzing video performance across creator libraries, four primary retention profiles emerge — and each demands a different diagnostic and remediation approach.
Audience Retention Decay Profiles
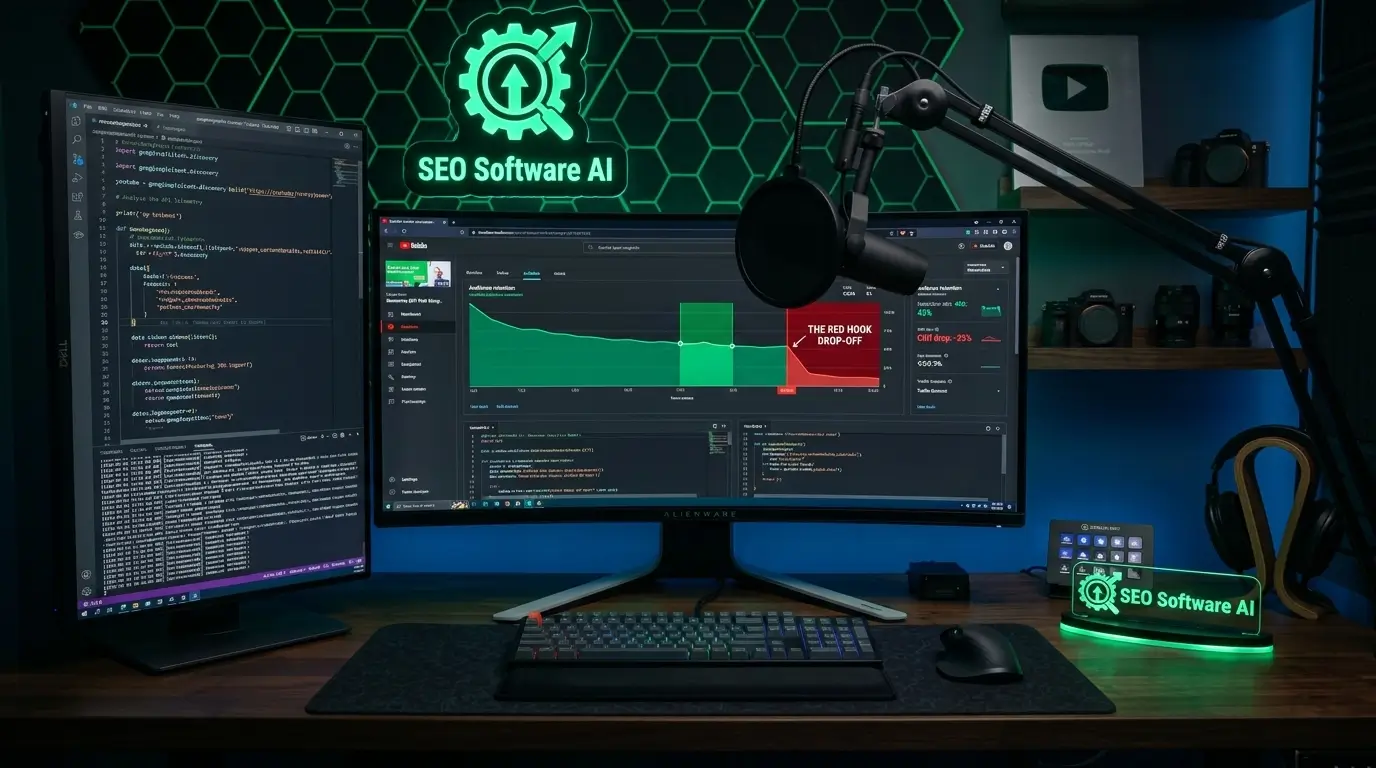
Comparing healthy gradual decay versus catastrophic 15-second hook drop-off
The 30-Second Hook Cliff Analysis
The most consequential decay pattern occurs within the initial window t ∈ [0, 30] seconds. In YouTube Analytics, this critical timeframe indicates whether your content fulfills initial viewer intent. Across technical and developer-focused creator channels, maintaining roughly 65% to 70% retention at the 30-second mark (R(30) ≥ 65%) generally serves as a strong baseline for sustained distribution. If retention falls below 50% within this window, the video exhibits a Hook Cliff — a rapid early-abandonment pattern. Mathematically, we evaluate the retention slope during this opening period:
Where R(0) is normalized to 100%. If Shook < −1.67% retention loss per second, the YouTube recommendation architecture reads this as high early dissatisfaction and suppresses the asset's impression share across Browse and Suggested surfaces. Before recording, creators can benchmark opening script structures against proven hook models using our headline and video hook analyzer. The primary root causes behind a Hook Cliff include:
- Thumbnail-to-Content Mismatch: Visuals or titles promise a specific technical answer — a Dockerfile fix, a Core Web Vitals diagnostic — that is entirely absent from frame 1 of the video.
- Verbal Drift: Broad introductory padding ("Hey guys, welcome back to the channel, don't forget to subscribe") instead of immediate topic resolution, measurably degrading early audience retention with every second of non-essential preamble.
- Aesthetic Obstacles: High-volume animated logos, cinematic drone shots, or splash screens that occupy 8 to 15 seconds before any actionable content appears on screen.
Mid-Roll Structural Decay Mechanics
When drop-offs occur after t = 30 seconds, the retention curve shifts from initial hook evaluation to continuous content engagement scoring. Mid-roll drops generally follow two distinct patterns:
- Gradual Exponential Decay: A smooth downward curve modeled by R(t) = A · e−λt. This natural decay reflects normal viewer fatigue and is expected. The objective is to minimize the decay constant λ by introducing visual variance, live code walk-throughs, on-screen annotation changes, and structural pacing shifts every 45 to 60 seconds. Under this analytical heuristic, a well-paced technical tutorial typically keeps λ below roughly 0.015.
- Vertical Step-Down Drops: Sudden cliff-like drops where retention falls sharply within a 5-second interval. In systematic video reviews, step-downs consistently trace back to three predictable structural triggers:
- Premature Verbal Signposting: The speaker uses phrases like "Now moving on to our final point..." or "So to wrap things up...", cueing viewers to close the tab before the outro even begins.
- Abrupt Visual Jumps: Missing audio crossfades between segments, or slide transitions that leave 2 to 3 seconds of dead air without narration.
- Dynamic Audio Fatigue: Sudden volume spikes — such as transition jingles peaking at −2 LUFS when speech sits at −24 LUFS — that induce listener strain, especially on mobile headphone users.
Extracting Retention Metrics via YouTube Analytics API
Manual inspection of YouTube Analytics via the web GUI is inadequate when auditing large video catalogs. Scrolling through individual retention graphs in YouTube Studio works for a channel with 20 videos; it breaks down entirely at 200 or 2,000. To isolate retention anomalies across hundreds of assets programmatically, you must query the YouTube Analytics Reporting API directly. The API exposes the elapsedVideoTimeRatio and viewerPercentage metrics, which together reconstruct the full retention curve for any given video at granular resolution. By pulling second-by-second analytics, you can calculate the exact rate of retention decay and flag videos that fall below baseline thresholds automatically. The Python script below authenticates via OAuth 2.0, requests retention data for a target video, computes the slope between consecutive time steps, and flags specific timestamps where retention drops exceed acceptable thresholds.
import os
import pandas as pd
import numpy as np
from googleapiclient.discovery import build
from google_auth_oauthlib.flow import InstalledAppFlow

# Authorization scope for YouTube Analytics read-only access
SCOPES = ['https://www.googleapis.com/auth/yt-analytics.readonly']

def get_authenticated_service():
    flow = InstalledAppFlow.from_client_secrets_file(
        'client_secrets.json', SCOPES)
    credentials = flow.run_local_server(port=0)
    return build('youtubeAnalytics', 'v2', credentials=credentials)

def fetch_retention_data(youtube_analytics, video_id):
    """
    Queries YouTube Analytics API for frame-by-frame retention metrics.
    Returns a DataFrame with elapsedVideoTimeRatio and viewerPercentage.
    """
    response = youtube_analytics.reports().query(
        ids='channel==MINE',
        startDate='2024-01-01',
        endDate='2024-12-31',
        metrics='viewerPercentage',
        dimensions='elapsedVideoTimeRatio',
        filters=f'video=={video_id}'
    ).execute()

    columns = [header['name'] for header in response['columnHeaders']]
    df = pd.DataFrame(response['rows'], columns=columns)
    return df

def analyze_retention_decay(df, cliff_threshold=-0.05):
    """
    Identifies exact timestamps where retention drops exceed the threshold.
    Returns flagged drop-off points and hook decay percentage.
    """
    df['viewerPercentage'] = df['viewerPercentage'].astype(float)
    df['elapsedVideoTimeRatio'] = df['elapsedVideoTimeRatio'].astype(float)

    # Calculate step-by-step delta between consecutive data points
    df['retention_delta'] = df['viewerPercentage'].diff()

    # Flag severe drop-off points (vertical step-down drops)
    severe_drops = df[df['retention_delta'] <= cliff_threshold]

    # Calculate 0-30s hook slope (first 5% of total video timeline)
    hook_data = df[df['elapsedVideoTimeRatio'] <= 0.05]
    if not hook_data.empty:
        initial_retention = hook_data.iloc[0]['viewerPercentage']
        hook_end_retention = hook_data.iloc[-1]['viewerPercentage']
        hook_decay = hook_end_retention - initial_retention
    else:
        hook_decay = 0.0

    return severe_drops, hook_decay

if __name__ == '__main__':
    analytics = get_authenticated_service()

    # Replace with your target video ID
    TARGET_VIDEO = "example_video_id"

    retention_df = fetch_retention_data(analytics, TARGET_VIDEO)
    drops, hook_loss = analyze_retention_decay(retention_df, cliff_threshold=-0.03)

    print(f"--- RETENTION DIAGNOSTIC REPORT: {TARGET_VIDEO} ---")
    print(f"Hook Performance (First 5% of timeline): {hook_loss:.2f}% drop")
    print(f"Identified {len(drops)} structural drop-off points:")
    print(drops[['elapsedVideoTimeRatio', 'viewerPercentage', 'retention_delta']])
Running this script across your full video catalog generates an automated diagnostic feed. Instead of manually inspecting individual retention graphs in YouTube Studio, you receive immediate programmatic flags whenever a newly published video triggers early hook decay or exhibits mid-roll structural step-downs. For broader metadata optimization across your channel — inspecting tag coverage, chapter timestamp alignment, and competitor keyword gaps — you can audit your full catalog using our suite of YouTube SEO and video analytics tools.
Executing Non-Destructive Hook A/B Testing Protocols
Once an audit reveals a retention cliff in the opening 30 seconds, the instinctive reaction is to delete and re-upload the video with a new intro. This is almost always the wrong move. Re-uploading wipes out accumulated watch time, existing search ranking signals, comment engagement, and algorithmic velocity history. A far superior, non-destructive method involves a structured three-phase optimization protocol that preserves every metric while surgically fixing the retention curve.
Phase 1: In-Editor Trim Testing via YouTube Studio
If your video experiences an immediate cliff caused by an animated intro or a slow opening monologue, you do not need to re-render or re-upload. YouTube Studio includes a native web editor that allows lossless video trimming without altering the video's URL, view count, or search position:
- Navigate to YouTube Studio > Content > [Target Video] > Editor.
- Select the Trim & Cut tool from the editor toolbar.
- Excise the first 8 to 15 seconds of non-essential preamble — the logo animation, the "welcome back" greeting, the slow fade-in — so playback begins directly on the visual problem statement or code demonstration.
- Save the edit. YouTube processes the cut server-side without generating a new video ID. Within 48 to 72 hours, the retention curve recalculates from the new starting frame, and you will observe the Hook Cliff flatten into a gradual decay pattern.
Phase 2: Metadata Alignment and Intent Verification
A retention cliff frequently stems from an intent mismatch: the title and thumbnail signal a quick, focused solution (e.g., "Fix Docker Build Cache in 3 Steps"), but the viewer encounters a 40-minute theoretical deep dive. This mismatch is invisible from impressions data alone — it only surfaces in the retention curve. To audit alignment between what your metadata promises and what your content delivers, use our YouTube tag extractor and optimizer to evaluate keyword coherence between your title, description timestamps, and video tags. If the highest-volume tags target tutorial-intent queries but your video opens with a conference-talk pacing, the mismatch is quantifiable and fixable without re-recording.
The 15-Second Hook Architecture Framework
Engineering high-retention openings requires a systematic script structure, not spontaneous improvisation. After analyzing retention curves across hundreds of high-performing technical guides on YouTube, an optimal 15-second opening sequence adheres to three distinct operational segments. Each segment serves a specific neurological and algorithmic function:
- Seconds 0–3 (Visual and Verbal Hook): Validate the exact query the viewer typed. Show the completed architecture diagram, the working code output, or the fixed bug on screen immediately while speaking the primary keyword phrase out loud. The viewer must see proof within 3 seconds that this video contains their answer.
- Seconds 4–8 (Stakes and Proof): Explain why alternative approaches fail or show the performance benchmark differential. Example: "Standard client-side hydration adds 420ms to your Interaction to Next Paint score — here is the edge middleware pattern that drops it to 45ms." This establishes credibility and creates an information gap the viewer must stay to close.
- Seconds 9–15 (Roadmap and Immediate Execution): State the workflow structure ("Three steps: isolate the render-blocking chain, deploy the fix, verify in Lighthouse") and immediately begin executing step one on screen. Never say "Let's get started" or "Before we begin." Start performing the action. The viewer is now committed.
Three Common Retention Failure Patterns
Scenario A: The High-Production Animated Logo Trap
The Scenario: A video opens with an 8-second 3D animated channel sting accompanied by loud synthesizer music. While aesthetically polished, the intro sequence contains zero informational context relevant to the user's search query.
The Impact: In this pattern, retention can drop from roughly 100% into the mid-50% range within the first ten seconds — triggering an immediate Hook Cliff before any instructional content begins.
# Problematic opening sequence timeline:
# 00:00 - 00:03  "Welcome back to the channel!"
# 00:03 - 00:11  [3D Logo Animation with Loud Synth Music]
# 00:11 - 00:20  "Today we are going to talk about Docker caching..."
# Estimated R(15): ~50% (Hook Cliff triggered)
The Resolution: Excise the intro sequence entirely using the YouTube Studio Editor. Start the video directly on the problem statement — such as the terminal showing the slow build log — followed immediately by the optimized result.
# Optimized opening sequence timeline:
# 00:00 - 00:04  "Your Docker builds take 6 minutes because layer caching
#                 is invalidated at this line." [Points at Dockerfile]
# 00:04 - 00:12  [Shows Dockerfile diff on screen] "Three lines fix this."
# Target R(15): >75% (Retention preserved)
Scenario B: The Premature Outro Signposting Leak
The Scenario: In a 20-minute guide, the presenter delivers strong content throughout the body of the video, but concludes with explicit verbal signposts: "So in summary, that is everything you need to know about schema validation. Make sure to subscribe and hit that bell..."
The Impact: Viewers close the tab immediately upon hearing closing summaries. Retention can drop precipitously in the final two minutes from over 65% down to under 20%, depressing overall average view duration and drastically lowering end-screen click-through rates.
The Resolution: Eliminate verbal closing summaries. Deliver the final technical insight at full pacing, then seamlessly transition into the end-screen recommendation card with a forward-pointing bridge: "Now that your schema passes Google's Rich Results validation, the next bottleneck is crawl budget — watch this guide to fix that."
Scenario C: Audio Dynamic Range Compression Flaws
The Scenario: A video has dialogue normalized around −24 LUFS while transition sound effects and music tracks peak near −2 LUFS — a 22 LUFS dynamic range gap.
The Impact: While desktop listeners may adjust volume, mobile viewers using headphones frequently experience auditory discomfort and abandon playback during graphics transitions, resulting in mid-roll step-down drops across the retention graph.
The Resolution: Master the audio track to −14 LUFS integrated (the YouTube loudness normalization target) with a strict brickwall limiter set at −1.0 dB True Peak. Gain-match all sound effects and music beds to sit no more than 3 LUFS above dialogue levels.
Hook Architecture Comparison Matrix
| Hook Framework | Target R(30) | Best Use Case | Key Risk and Pitfall |
|---|---|---|---|
| Direct Result Preview | 75% – 85% | Coding tutorials, bug fixes, performance audits | Revealing the full solution too early without explaining the diagnostic mechanism reduces mid-roll watch time |
| Problem Diagnosis Hook | 68% – 78% | System architecture reviews, SEO penalty recovery guides | Over-explaining theoretical background context before showing visible symptoms or broken output |
| Contrarian Benchmark Hook | 70% – 82% | Framework comparisons, rendering speed optimization | Creating sensationalist performance claims that fail technical scrutiny and erode channel trust |
| Traditional Narrative Preamble | 35% – 48% | Vlogs, personal essays (unsuitable for technical content) | Severe 30-second Hook Cliff leading to algorithmic recommendation suppression across all surfaces |
Frequently Asked Questions
What is the minimum 30-second retention rate needed for YouTube recommendation?
YouTube evaluates retention relative to niche-specific baselines, not a single universal threshold. That said, technical and educational videos generally require at least 65% to 70% retention at the 30-second mark to earn widespread recommendation on Home and Suggested feeds. Videos falling below 50% at t = 30 are rarely promoted beyond existing subscriber notification feeds, regardless of how well-optimized the title and thumbnail are.
Does editing a video in YouTube Studio reset its view count or search ranking?
No. Trimming a video using YouTube Studio's built-in web editor preserves the URL, view count, comments, likes, and current search ranking position. The platform modifies the underlying media stream losslessly on its servers. This allows you to surgically fix early retention cliffs — excising dead intros or slow preambles — without sacrificing any accumulated algorithmic history or engagement signals.
How does YouTube's Expected Watch Time model evaluate short versus long videos?
YouTube balances percentage-based retention against absolute watch time contributed. A 20-minute video with 40% average retention delivers 8 minutes of total watch time per viewer session, which may outperform a 3-minute video with 70% retention contributing only 2.1 minutes. However, a severe 30-second hook cliff will throttle impression delivery regardless of total video duration, because the recommendation system interprets the early abandonment as a content-quality failure signal before total watch time can accumulate.
Can adding video chapters improve audience retention curves?
Yes, and the effect operates on two levels. First, descriptive chapters allow viewers to jump directly to the section matching their specific search intent rather than abandoning the entire video when the opening does not immediately address their query. Second, well-structured timestamps with keyword-rich chapter titles qualify your video for Google Key Moments rich results in organic web search, creating an additional discovery surface that drives high-intent viewers directly into the most relevant segment of your content.
Should I delete and re-upload a video that suffered a severe retention cliff?
Re-uploading is almost always the wrong approach unless the video has accumulated fewer than 100 total views. Deleting a video permanently removes its engagement history — comments, likes, shares, watch time — and creates duplicate content signals if the re-uploaded version has a similar title and description. The non-destructive path is far more effective: trim dead air using YouTube Studio Editor, update the thumbnail to align with the new opening frame, and revise the title to match viewer intent precisely.
Key Takeaway: High audience retention is an engineered outcome, not an artistic accident. By auditing decay slopes programmatically with the YouTube Analytics API, cutting early fluff via non-destructive Studio edits, and structuring your first 15 seconds around instant query validation, you protect your entire catalog from silent distribution throttles. You can benchmark and optimize your video metadata, tags, and chapter timestamps using our live YouTube SEO and video analytics tools on SEO Software AI.